


1. Introduction
Last month we introduced our semi-annual report on the state of AGI and we highlighted R&D spending across the mega caps. This month we put that R&D number in context to help you understand what it means. After that, we provide evidences showing how spending on innovation is strongly linked to both excess shareholder returns and revenue durability.
2. An R&D Super‑Cycle
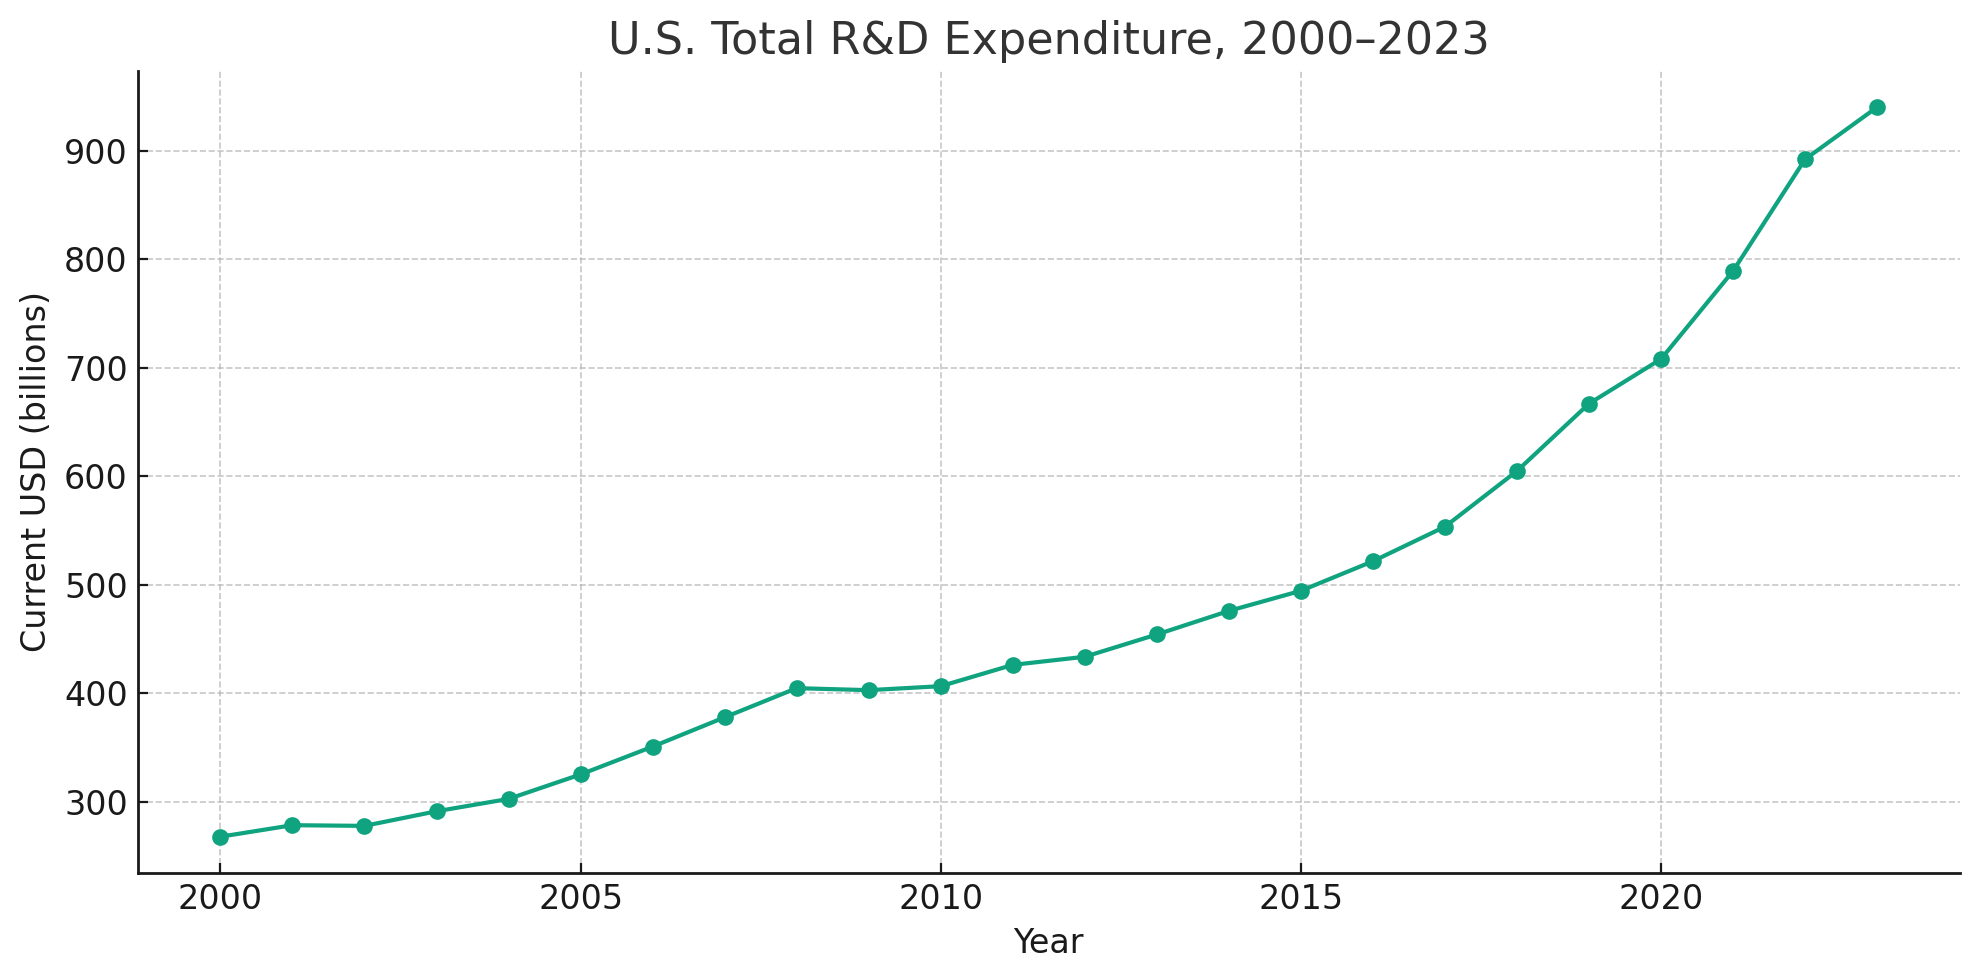
We are witnessing an R&D super‑cycle unrivalled in corporate history. Corporate America has never spent this much ever in history, at least not in absolute dollars.
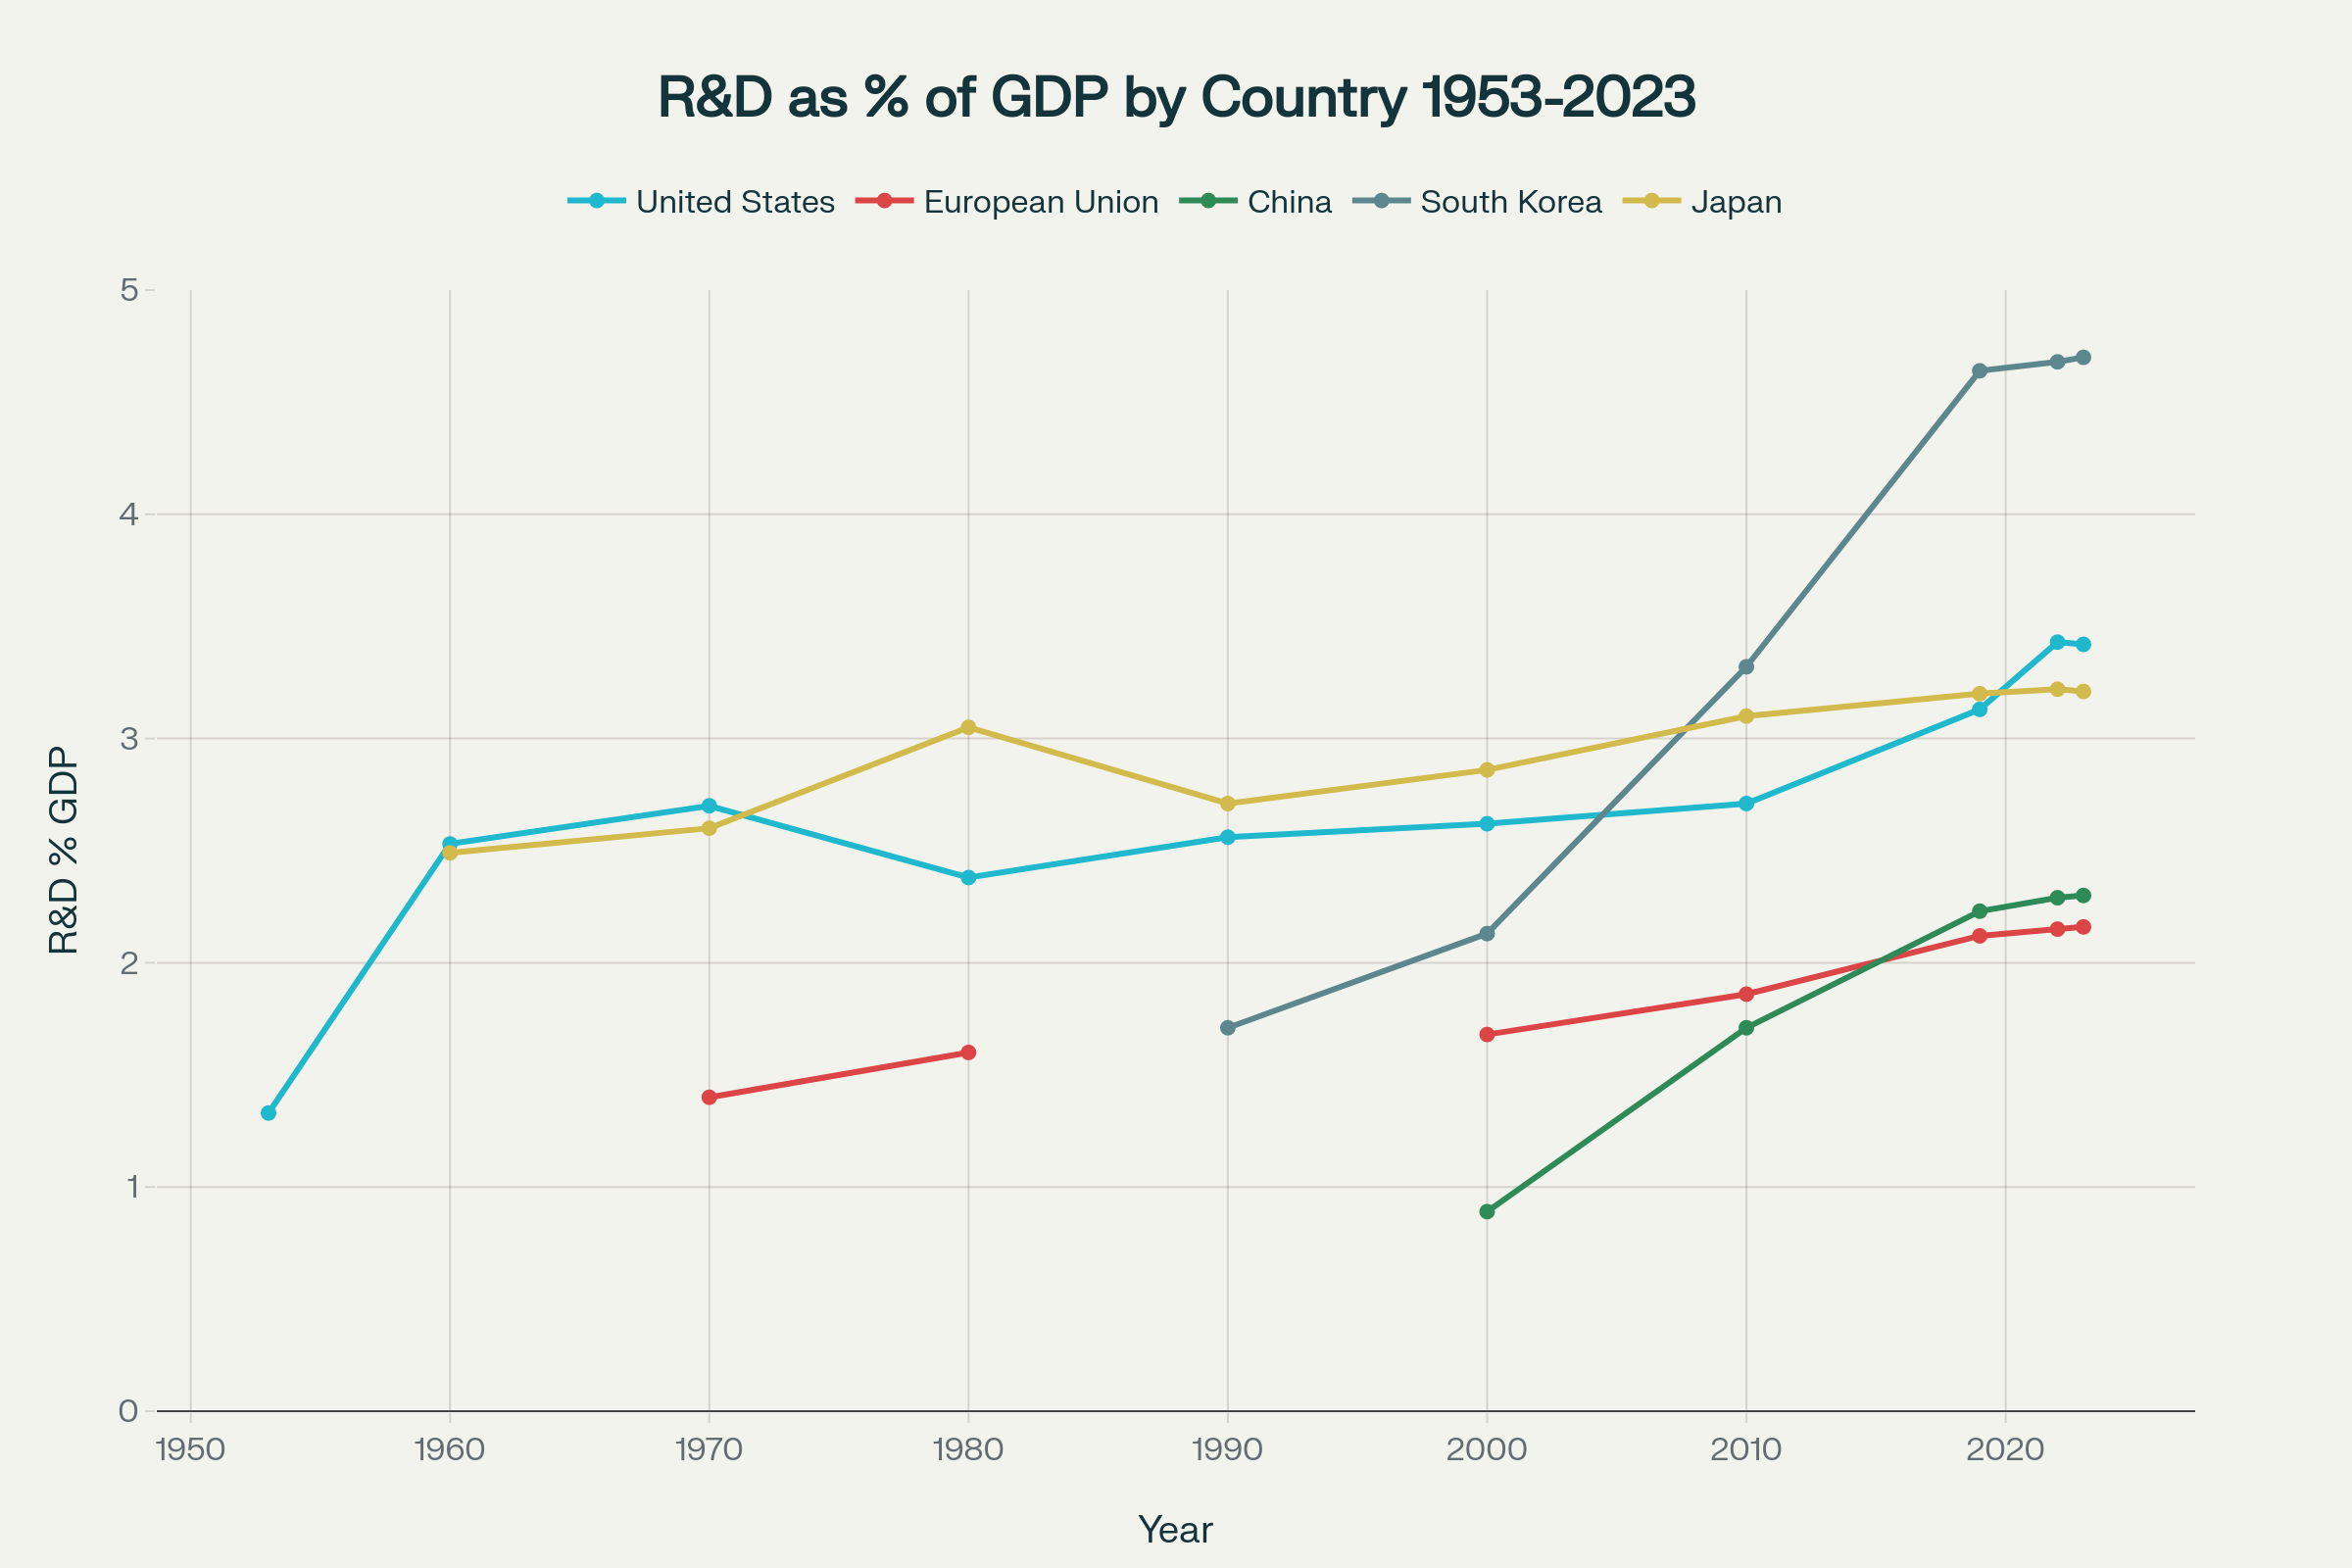
To put this in a global context, over the past several decades, major economies have steadily increased their R&D spending relative to GDP, with the United States reaching over 3% and South Korea emerging as the global leader by exceeding 4.5%. While Japan and the European Union have maintained strong and stable investment near or above 2–3%, China’s rapid rise since the early 2000s reflects its substantial commitment to technological advancement.
As a share of the economy, U.S. total R&D (all sectors) now hovers around 3.4 % of GDP, matching the space-race peaks of the late-1960s, but the mix has flipped: in the 1960s government wrote most of the cheques; today the corporate sector funds three-quarters. Thus, what is unprecedented is the concentration: half a dozen firms are spending a quarter-trillion dollars a year, more than the entire Fortune 500 did a generation ago.
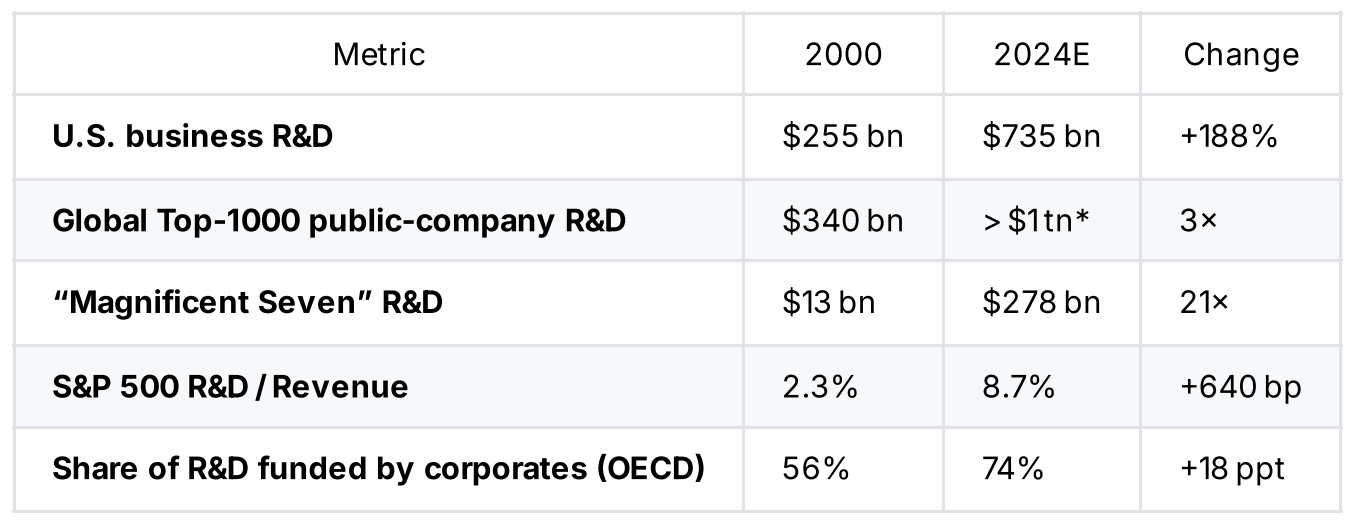
In particular, Six US mega‑caps alone—Apple, Microsoft, Alphabet, Amazon, Meta and Nvidia—now invest ≈ $250 billion per year in research, roughly equal to the entire U.S. private‑sector R&D bill at the peak of the 2000 dot‑com boom. The key takeaway here is that the centre of gravity for advanced research has shifted from government labs to the corporate P&L, with an unprecedented concentration in a handful of tech titans.
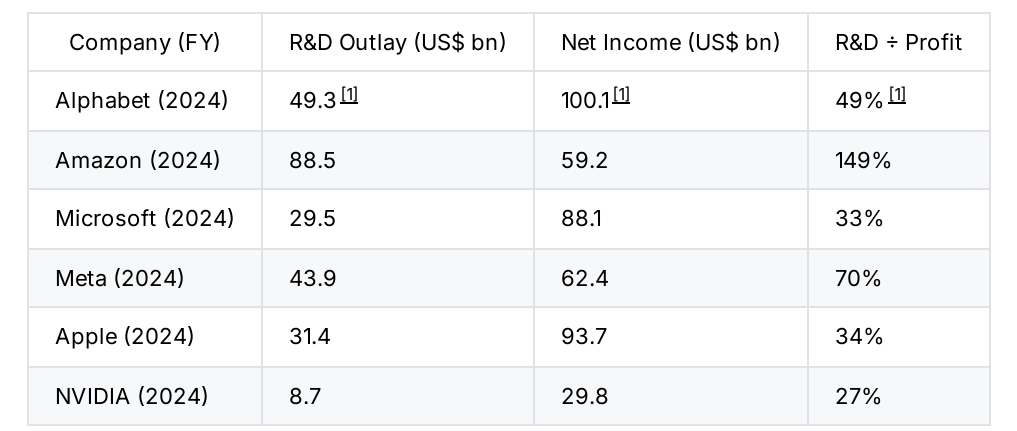
In terms of R&D as percentage of corporate profit and revenues, check out the following astonishing tables:
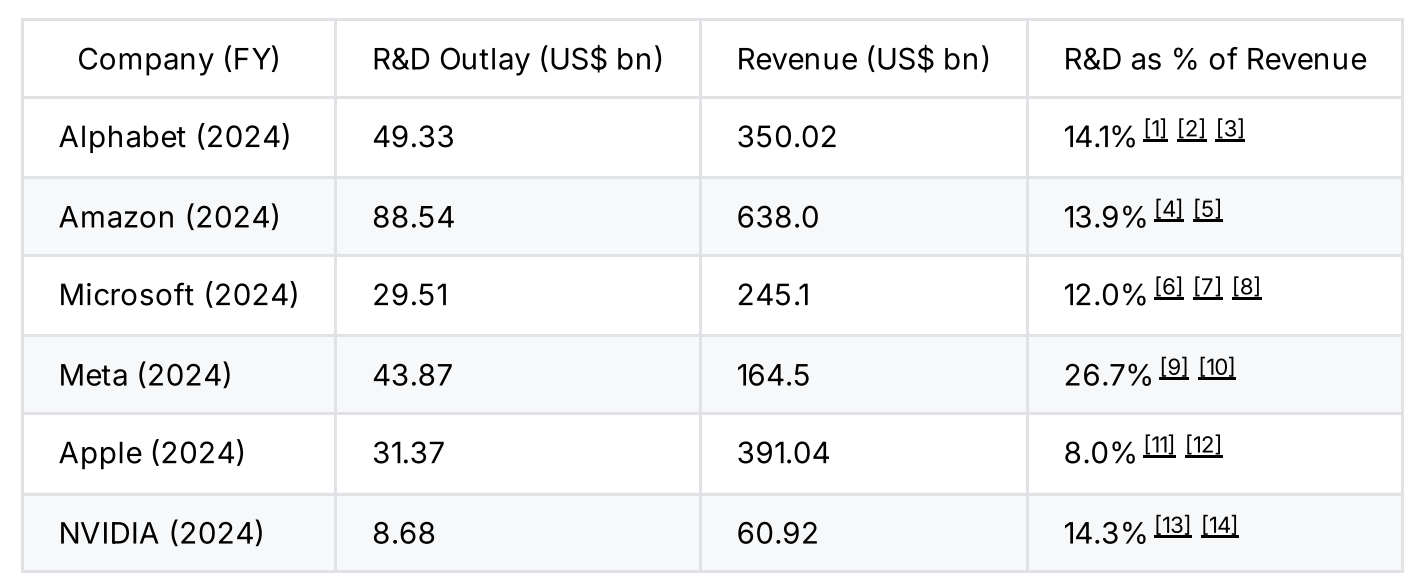
Those ratios are impressive per se and need no extra comment but taken together:
The six giants devoted roughly $252 billion to R&D last year, about 15¢ of every revenue dollar they generated, underscoring the scale of the AI arms race now under way. (Average Megacaps R&D Spending/revenue ≈ 15%)
Five of the six are spending at least one dollar in three of earnings, with Amazon and Meta going well beyond that mark. (Average Megacaps R&D Spending/profit ≈ 60%)
3. What the Numbers Say: Innovation Pays Investors
In an era of AI arms races and digital moats, research and development (R&D) has become the defining trait of industry winners. But does the market reward firms that spend heavily on R&D? And is there hard evidence that innovation really pays off—for both companies and shareholders?
According to academic studies and market-based evidence, firms who sustain R&D investment are more likely to grow faster, stay profitable, and outperform over time. Four flagship studies stand out:
Eberhart, Maxwell & Siddique (Journal of Finance, 2004) track 8,313 surprise R&D jumps and find +12 % abnormal stock returns in the three years that follow.
Chan, Lakonishok & Sougiannis (2001) sort 2,000 U.S. stocks by R&D‑to‑market‑value and see 6–10 percentage points of annual “excess” return for the intangibles‑rich names.
Kruglov & Shaw (2024) crunch a quarter‑century of S&P 500 data and show that higher R&D intensity cushions EBITDA margins in recessions and accelerates top‑line growth in the rebound.
BCG’s “Innovation Race” (2025) demonstrates that firms consistently ranked “Most Innovative” out‑perform the global market by 2.4 p.p. a year—and widen the gap precisely when crises hit.
Different data sets, different lenses, one conclusion: persistent, focused R&D buys you time‑arbitrage alpha. The market undervalues the payoff at first, then reprises the shares as projects bear fruit.
4. Why the Correlation Exists
Cash‑flow flywheel. Big margins finance big research budgets, which in turn generate new high‑margin products. Think AWS inside Amazon or Apple Silicon inside iPhones.
Network & data effects. More users mean richer data sets, making each incremental research dollar more potent.
Moats you can’t copy. Patents, proprietary models and chip architectures build hurdles competitors struggle to clear.
Investor signalling. A fat R&D cheque says, “We’re skating to where the puck is going.” Valuations follow.
Policy leverage. Tax credits and accelerated amortisation lower the true cost of every R&D dollar—benefits that scale with revenue.
5. The Downside Hedge Most Portfolios Miss
The same studies that highlight upside also reveal a hidden bonus: resilience. R&D‑heavy firms shed less margin in downturns and bounce back faster when sentiment turns. In a world where macro shocks seem to arrive every other year, that built‑in insurance is worth its weight in liquidity.
6. The Final Word
Every industrial revolution has been powered by capital spend: railroads, steel, electrification. Today’s revolution is different—its factories are filled with code and GPUs, not smokestacks. The lesson, however, is the same: fund the future or fade into history. For investors willing to follow the R&D breadcrumb trail, the odds of catching tomorrow’s winners have rarely looked better.
Prepared by AI Monaco
AI Monaco is a leading-edge research firm that specializes in utilizing AI-powered analytics and data-driven insights to provide clients with exceptional market intelligence. We focus on offering deep dives into key sectors like AI technologies, data analytics and innovative tech industries.